Available 7 Days/Week       MON - FRI  8am - 7pm       SAT - SUN  10am – 6pm
Call us (888) 259-2257
Apply Now

Tag: Pricing

Fact or Fiction: Homebuyer Edition [INFOGRAPHIC]

Fact or Fiction: Homebuyer Edition [INFOGRAPHIC] | Simplifying The Market

Fact or Fiction: Homebuyer Edition [INFOGRAPHIC] | Simplifying The Market

Some Highlights

  • When it comes to the current housing market, there are multiple misconceptions – from what the current supply of available homes looks like to how much houses are selling for.
  • It takes professionals who study expert opinions and data to truly understand the real estate market and separate fact from fiction.
  • Trust the pros. If you want to understand why it’s still a good time to buy, let’s connect today.
Content previously posted on Keeping Current Matters Fidelity Home Group | Home Buyer Experts | Mortgage Rates

#fidelityhomegroup, #homebuyerexperts, Buying Myths, First Time Home Buyers, For Buyers, Infographics, Interest Rates, Move-Up Buyers, Pricing

Home Price Appreciation Is Skyrocketing in 2021. What About 2022?

Home Price Appreciation Is Skyrocketing in 2021. What About 2022? | Simplifying The Market

One of the major story lines over the last year is how well the residential real estate market performed. One key metric in the spotlight is home price appreciation. According to the latest indices, home prices are skyrocketing this year.

Here are the latest percentages showing the year-over-year increase in home price appreciation:

The dramatic increases are seen at every price point and in all regions of the country.

Increases Are Across Every Price Point

According to the latest Home Price Index from CoreLogic, each price range is seeing at least a 19% increase year-over-year:Home Price Appreciation Is Skyrocketing in 2021. What About 2022? | Simplifying The Market

Increases Are Across Every Region in the Country

Every region in the country is experiencing at least a 14.9% increase in home price appreciation, according to the Federal Housing Finance Agency (FHFA):Home Price Appreciation Is Skyrocketing in 2021. What About 2022? | Simplifying The Market

Increases Are Across Each of the Top 20 Metros in the Country

According to the U.S. National Home Price Index from S&P Case-Shiller, every major metro is seeing at least a 13.3% growth in prices (see graph below):

Home Price Appreciation Is Skyrocketing in 2021. What About 2022? | Simplifying The Market

What About Price Appreciation in 2022?

Prices are the result of the balance between supply and demand. The demand for single-family homes has been strong over the last 18 months. The supply of houses available for sale was near historic lows. However, there’s some good news on the supply side. Realtor.com reports:

“432,000 new listings hit the national housing market in August, an increase of 18,000 over last year.”

There will, however, still be a shortage of supply compared to demand in 2022. CoreLogic reveals:

“Given the widespread demand and considering the number of standalone homes built during the past decade, the single-family market is estimated to be undersupplied by 4.35 million units by 2022.”

Yet, most forecasts call for home price appreciation to moderate in 2022. The Home Price Expectation Survey, a survey of over 100 economists, investment strategists, and housing market analysts, calls for a 5.12% appreciation level next year. Here are the 2022 home appreciation forecasts from the four other major entities:

  1. The National Association of Realtors (NAR): 4.4%
  2. The Mortgage Bankers Association (MBA): 8.4%
  3. Fannie Mae: 5.1%
  4. Freddie Mac: 5.3%

Price appreciation is expected to slow in 2022 when compared to the record highs of 2021. However, it is still expected to be greater than the annual average of 4.1% over the last 25 years.

Bottom Line

If you owned a home over the past year, you’ve seen your household wealth grow substantially, and you’ll see another nice boost in 2022. If you’re thinking of buying, consider buying now as prices are forecast to continue increasing through at least next year.

Content previously posted on Keeping Current Matters Fidelity Home Group | Home Buyer Experts | Mortgage Rates

#fidelityhomegroup, #homebuyerexperts, For Buyers, For Sellers, Housing Market Updates, Pricing

Your Agent Is Key When Pricing Your House [INFOGRAPHIC]

Your Agent Is Key When Pricing Your House [INFOGRAPHIC] | Simplifying The Market

Your Agent Is Key When Pricing Your House [INFOGRAPHIC] | Simplifying The Market

Some Highlights

  • Pricing your house right takes market experience and expertise.
  • To find the best list price, your agent balances current market demand, values of homes in your neighborhood, where prices are headed, and your home’s condition.
  • If you’re ready to sell, don’t guess on the price. Let’s connect today so we price your house to attract multiple offers and maximize your return on investment.
Content previously posted on Keeping Current Matters Fidelity Home Group | Home Buyer Experts | Mortgage Rates

#fidelityhomegroup, #homebuyerexperts, For Sellers, FSBOs, Infographics, Pricing

5 Reasons Today’s Housing Market Is Anything but Normal

5 Reasons Today's Housing Market Is Anything but Normal | Simplifying The Market

There are many headlines out there that claim we’re reverting to a more normal real estate market. That would indicate the housing market is returning to the pre-pandemic numbers we saw from 2015-2019. But that’s not happening. The market is still extremely vibrant as demand is still strong even while housing supply is slowly returning.

Here’s the definition of normal from the Merriam-Webster Dictionary:

“conforming to a type, standard, or regular pattern: characterized by that which is considered usual, typical, or routine.

Using this definition, here are five housing industry metrics that prove we’re nowhere near normal.

1. Mortgage Rates

If we look at the 30-year mortgage rate chronicled by Freddie Mac, we can see the average rates by decade:

  • 1970s: 8.86%
  • 1980s: 12.7%
  • 1990s: 8.12%
  • 2000s: 6.29%
  • 2010s: 4.09%

Today, the average mortgage rate stands at 2.87%, which is very close to the historic low.

Currently, mortgage rates are anything but usual, typical, or routine.

2. Home Price Appreciation

According to Black Knight, a housing data and analytics company, the average annual appreciation on residential real estate prices since 1995 has been 4.14%.

According to the latest forecast from the National Association of Realtors (NAR), home price appreciation will hit 14.1% this year, which will be greater than any year since Black Knight began collecting this data.

Currently, home price appreciation is anything but usual, typical, or routine.

3. Months’ Supply of Inventory (Homes for Sale)

According to NAR:

“Months’ supply refers to the number of months it would take for the current inventory of homes on the market to sell given the current sales pace. Historically, six months of supply is associated with moderate price appreciation, and a lower level of months’ supply tends to push prices up more rapidly.”

As of the latest Existing Homes Sales Report from NAR, the current months’ supply of inventory stands at 2.6. That’s less than half of a normal supply.

Currently, the supply of homes for sale is anything but usual, typical, or routine.

4. Days It Takes To Sell a Home

The days-on-market metric gives an indication of how hot a market is and how quickly homes are selling. In 2019, prior to the pandemic, the average days on market stood at 35, according to NAR. Today, that number is cut in half and is now at 17 days.

Currently, the days-on-market metric is anything but usual, typical, or routine.

5. Number of Offers per Listing

According to NAR, the number of offers per listing stood at 2.2 in 2019. Today, that number is double at 4.5.

Currently, the number of offers per listing is anything but usual, typical, or routine.

Bottom Line

When…

  1. Mortgage rates are near historic lows
  2. Price appreciation is at historic highs
  3. Housing inventory is less than half of the normal amount
  4. The time it takes to sell a home is cut in half, and
  5. There are twice as many offers on each house

…it’s hard to say we’re in a normal market.

Content previously posted on Keeping Current Matters Fidelity Home Group | Home Buyer Experts | Mortgage Rates

#fidelityhomegroup, #homebuyerexperts, For Buyers, For Sellers, Housing Market Updates, Interest Rates, Pricing

If Housing Affordability Is About the Money, Don’t Forget This.

If Housing Affordability Is About the Money, Don’t Forget This. | Simplifying The Market

There are many non-financial benefits of buying your own home. However, today’s headlines seem to be focusing primarily on the financial aspects of homeownership – specifically affordability. Many articles are making the claim that it’s not affordable to buy a home in today’s market, but that isn’t the case.

Today’s buyers are spending approximately 20% of their income on their monthly mortgage payments. According to The Essential Guide to Creating a Homebuying Budget from Freddie Mac, the 20% of income that purchasers are currently paying is well within the 28% guideline suggested:

“Most lenders agree that you should spend no more than 28% of your gross monthly income on a mortgage payment (including principal, interest, taxes and insurance).”

So why is there so much talk about challenges regarding affordability?

It’s Not That Homes Are Unaffordable – It’s That They’re Less Affordable.

Since home prices are rising, it’s true that homes are less affordable than they have been since the housing crash fifteen years ago. Headlines making these claims aren’t incorrect; they just don’t tell the whole story. To paint the full picture, you have to look at how today stacks up with historical data. A closer analysis of affordability going further back in time reveals that homes today are more affordable than any time from 1975 to 2005.

Despite that, the chatter about affordability is pushing some buyers to the sidelines. They don’t feel comfortable knowing someone else got a better deal a year ago.

However, Are Homes Really Less Affordable if We Consider Equity?

In a recent post, Odeta Kushi, Deputy Chief Economist at First American, offers a different take on the financial components of housing affordability. Kushi proposes we should at least consider the impact equity build-up has on the affordability equation, stating:

“For those trying to buy a home, rapid house price appreciation can be intimidating and makes the purchase more expensive. However, once the home is purchased, appreciation helps build equity in the home, and becomes a benefit rather than a cost. When accounting for the appreciation benefit in our rent versus own analysis, it was cheaper to own in every one of the top 50 markets.”

Let’s look at an example. In the above-mentioned post, Kushi examines the rent versus buy situation in Dallas, Texas. Kushi chose Dallas because home prices there sit near the median of the top 50 markets in the nation.

Kushi first calculates the monthly mortgage payment on a median-priced home with a 5% down payment and a mortgage rate of 3% (see chart below):If Housing Affordability Is About the Money, Don’t Forget This. | Simplifying The MarketKushi then takes the monthly cost and subtracts the appreciation the home had over the previous twelve months. The average house price in Dallas increased 17.5% in the second quarter of 2021 compared to last year (this is in line with the national pace). That equates to an equity benefit of approximately $3,550 each month if the pace remains the same (see chart below):If Housing Affordability Is About the Money, Don’t Forget This. | Simplifying The Market
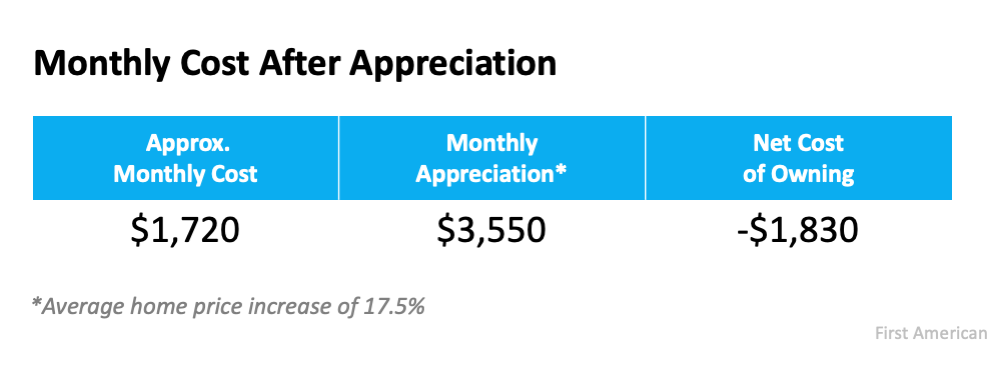
We can see the equity gained each month was greater than the monthly mortgage payment, resulting in a negative cost to own. The buyer could build their net worth by $1,830 each month – after paying their mortgage.

Kushi then compares the monthly cost of owning to the cost of renting (see chart below):If Housing Affordability Is About the Money, Don’t Forget This. | Simplifying The MarketWhen adding equity build-up into the equation, the cost of renting is $3,140 more expensive than owning. Again, the First American analysis shows that it’s less expensive to own in each of the top 50 markets in the country when including the equity component.

Bottom Line

If you’re on the fence about whether to buy or rent right now, let’s connect so we can determine if the equity increase in our local market should impact your decision.

Content previously posted on Keeping Current Matters Fidelity Home Group | Home Buyer Experts | Mortgage Rates

#fidelityhomegroup, #homebuyerexperts, First Time Home Buyers, For Buyers, Interest Rates, Pricing, Rent vs. Buy